
The Survivability Scale
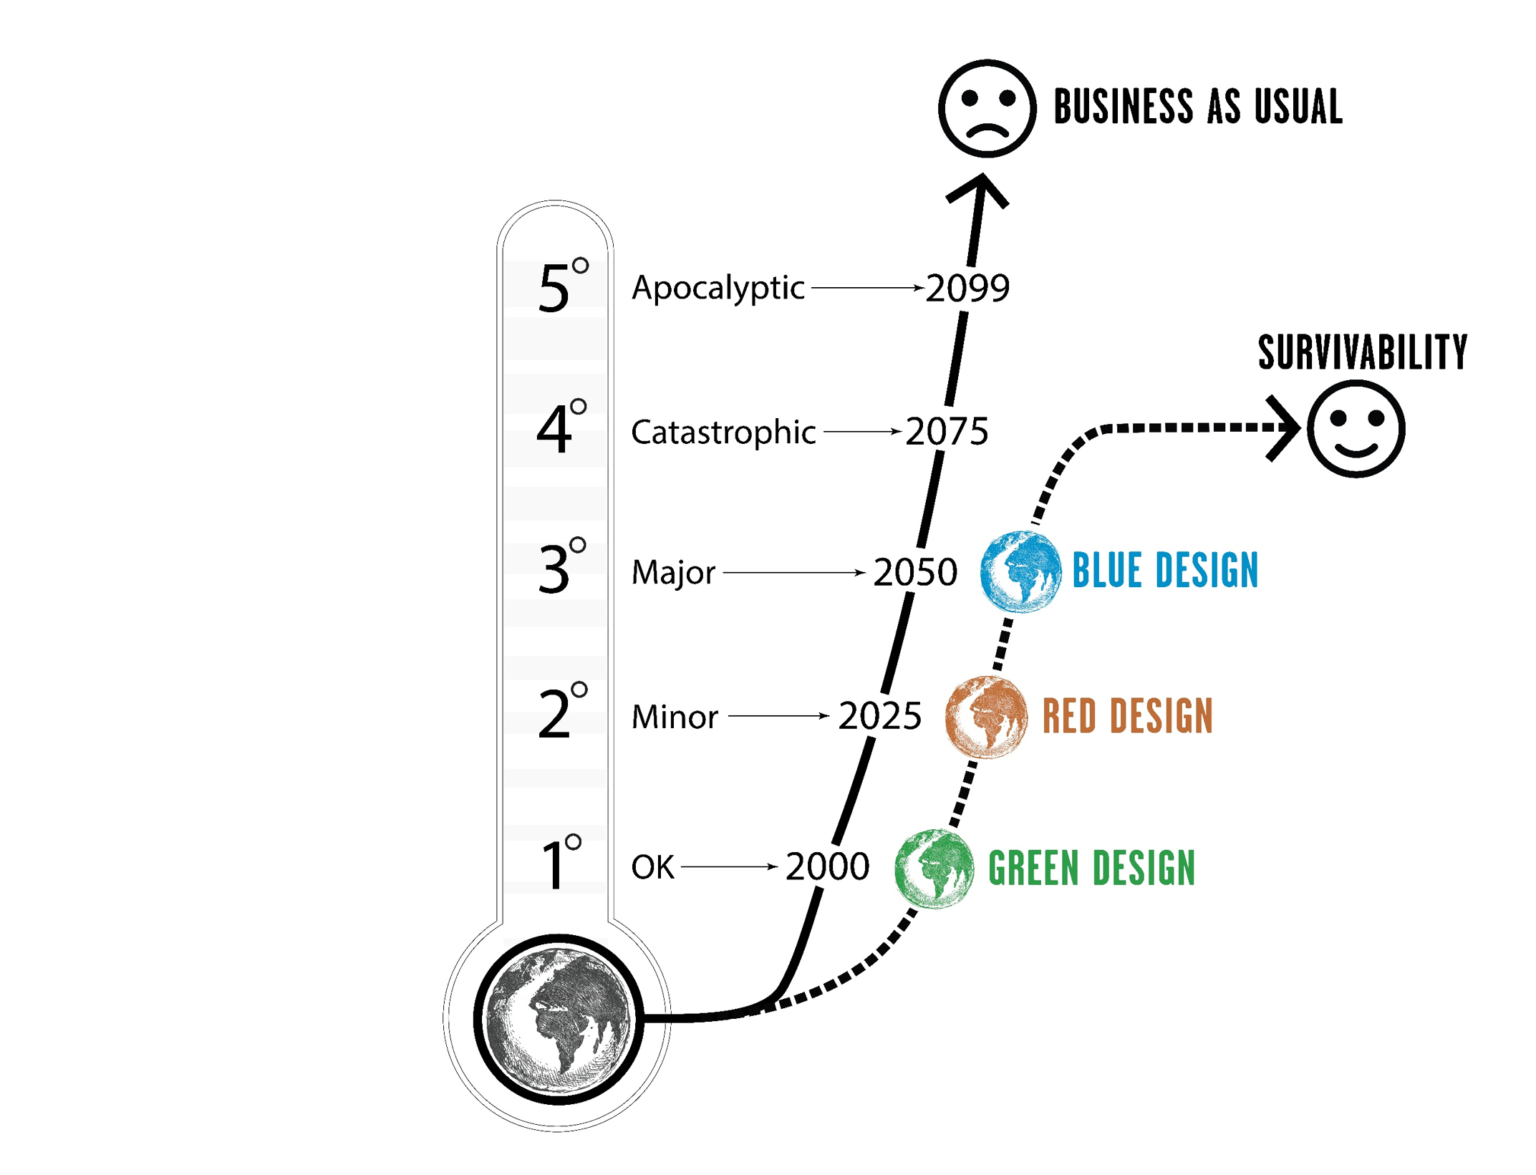
The Survivability Scale is loosely based on the Richter Scale, which measures earthquake magnitude by size and damage. Here is how the Survivability Scale works:
- The ‘X’ axis across the bottom denotes time. As you can see, global heating is accelerating at a remarkable pace, much faster than we can deal with. This is the part where we begin to see that we will fail in our battle to reverse global warming.
- The ‘Y’ axis denotes the level of planetary destruction as a function of global heating. The ‘Y’ axis also illustrates two possible futures. The ‘Business as Usual’ path leads to the frightening apocalyptic future that keeps us up at night. The ‘Survivability’ path still depicts a troubling future, but through the efforts of Green Design, Red Design, and Blue Design, humanity can do what it always does: survive!
So, what are these simple color-coded design approaches? I am glad you asked. I share a brief explanation below:
- Green Design: Double down on well-established sustainable design strategies to limit future warming to 4°C by 2075.
- Red Design: Pursue life-saving, climate-adaptive design strategies to give humanity a fighting chance to survive the climate catastrophe.
- Blue Design: Apply life-enhancing regenerative design practices to reconnect humans to nature and achieve an abundant, thriving, and inspiring future.
Want to learn more? Join the Survivability Community by opting in to the email list below or following us on social media.